

Confused by Google PageSpeed Insights? You’re not alone.
Google PageSpeed Insights’ scores are often a little confusing and misleading if taken on face value. While this tool is helpful for web developers in finding opportunities to improve performance, the test results themselves should not be taken as an actual reflection of performance. In other words, PageSpeed Insights (PSI) is more of a diagnostic tool that can help find improvement opportunities – it’s not so much a test that gauges actual performance while elements of performance are used. This already probably sounds confusing, because it is, but stick around as we expand just a bit more; then we’ll move onto the broader context.
Google’s PageSpeed score is not based on actual performance but on lab data-driven performance. Lab data means Google collects performance data in a controlled environment – it’s a simulation; not an actual speed test in the real world environment. The simulation is performed with a predefined device and network settings that Google has determined is appropriate. Because the conditions of the simulation / test are predefined by Google, PageSpeed score doesn’t reflect real user experience at 100%. After all, one of Google’s biggest web properties, YouTube, gets pretty poor marks across the board on their own PageSpeed Insights test.
Don’t get us wrong, Google’s PSI scores are important and can affect SEO since part of their ranking algorithm is based on the speed of your website. With that said, we wouldn’t recommend using solely Google’s PageSpeed Insights to determine your website’s overall state of health as far as performance goes. After all, these are just “insights” – not actual real-world results. Many websites with great rankings have terrible PSI scores while other sites with great PSI scores have terrible rankings. Speed, performance, and technical testing results are only part of an SEO strategy.
Rather than trying to explain each technical element and grading process within PSI, we’ll try to explain what Google PageSpeed Insights does and does not do. Hopefully you might gain some context for the results you’re seeing and learn about some alternatives that might add context to give you a better overall view of your website’s performance.
What do these results mean?
So you just ran a Google PageSpeed Insights test and you’re horrified by the results. Or, in another common scenario, you just received a solicitation email where a salesman ran your Google PageSpeed Insights test – the results are “terrible,” but you can pay this person to “fix it.” Whatever your situation is, the odds are this: there’s room for improvement and the startling score is not as bad as you might think.
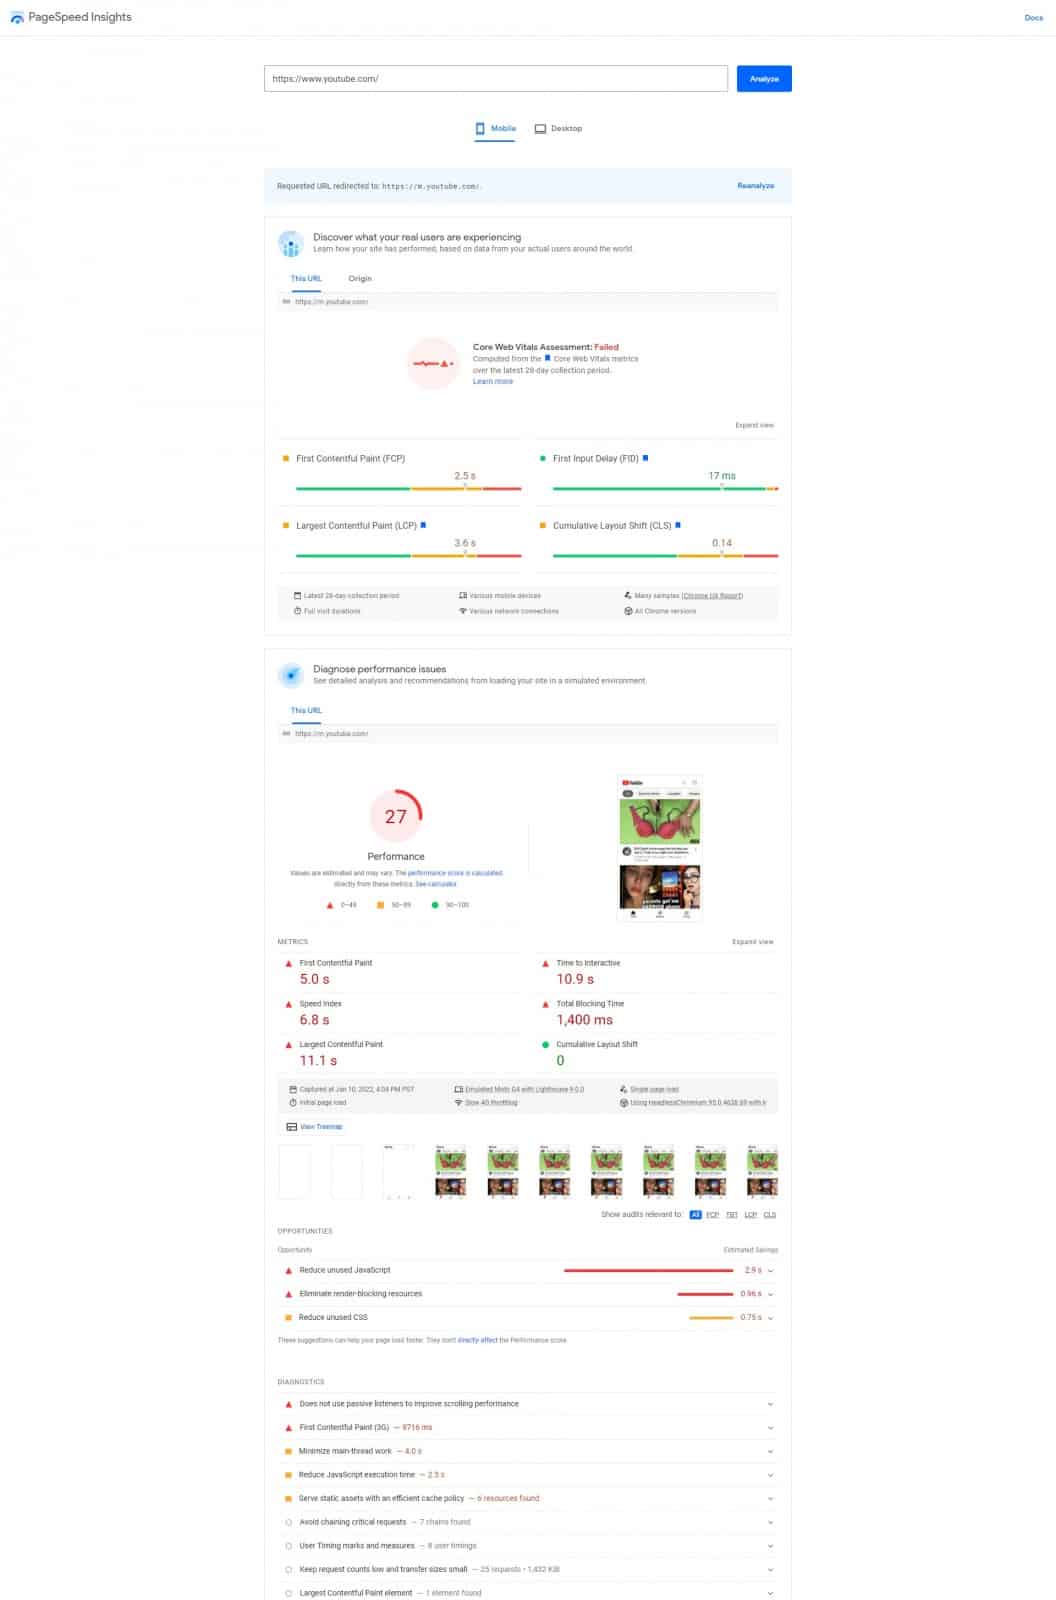
According to Google’s own About PageSpeed Insights documentation, “A score of 90 or above is considered good. 50 to 90 is a score that needs improvement, and below 50 is considered poor.” As of Jan 10th, 2022, Google’s own “YouTube.com” received a performance score of 27 on mobile and 39 on desktop. Google also gives YouTube a Core Web Vitals Assessment result of “Failed.” It sounds crazy, but we have the screenshots to prove it.
Mobile Performance Score – YouTube – 01/10/22
Desktop Performance Score – YouTube – 01/10/22

Are the results wrong or misunderstood?
How can it be that YouTube.com, one of the faster websites online and a property of Google itself, is failing its own Core Web Vital Assessments in addition to scoring “Poor” on the performance scale? The thing to understand is that these scores do not mean that a site is performing horribly, won’t rank well, or is a doomed failure. YouTube is proof and there are more examples below. If you use YouTube (like everyone else), you’ve probably never thought it terribly slow or inefficient. After all, YouTube is the world’s second most popular search engine ranking only behind Google and far ahead of both Yahoo and Bing combined.
The PSI performance score is not a grade as much as it’s a meter to gauge your room for improvement. The score and all the other metrics are feedback on technical areas of the site to provide “insights” into performance opportunities. The grade is actually an indicator of opportunities. It is not necessarily a grade of actual real-life load times. Or in Google’s words, the grades have to do with “suggestions to make that page faster;” they are not grading how fast the page actually is.
Take a look at how some of the big players stack up on an PageSpeed Insights tests:
- YouTube’s results: https://pagespeed.web.dev/report?url=youtube.com
- Best Buy’s results: https://pagespeed.web.dev/report?url=bestbuy.com
- Amazon’s results: https://pagespeed.web.dev/report?url=amazon.com
- Target’s results: https://pagespeed.web.dev/report?url=target.com
- Walmart’s results: https://pagespeed.web.dev/report?url=walmart.com
While YouTube, a Google property, gets bad marks on their own test, even saying that is technically incorrect because Google PageSpeed Insights is not testing page load – it simply provides insights and score that let’s you know if you should seek improvements. These aren’t pass or fail grades like we’d see in school. They’re scores gauging speed opportunities – not speed. In reality, Best Buy and YouTube load just fine and pass actual Speed Tests (while “failing” PageSpeed Insights if you’re looking at it that way).
Website speed test alternatives
When you get about 5 minutes, read through this https://wp-rocket.me/
In our opinion, Pingdom offers an easier way for the average user to interpret their website’s performance because it’s actually testing a website’s speed-to-load and it generates suggestions based on actual load times. Other speed test websites like GT Metrix and more also offer grades, insights, suggestions and more. And as you test your website on each of these sites, you’ll see different scores and grades. The reason is that these sites test your website’s load time from different locations using various metrics. Also, the time of day that you perform these tests can alter the score result as well based on the traffic (or lack thereof) your website is currently handling.
So what does this all mean?
Different website speed tests will result in different grades, scores, and metrics. If you want to get a good feel of your website’s technical performance, use all the different website testing services: Pingdom, GT Metrix, PageSpeed Insights, WebPageTest, and more. Also, be sure to run these tests from the various locations that these services offer (e.g. San Francisco, Washington DC, etc). The location of the test and it’s distance from where your web hosting server is located will make a difference. The further the location from your web hosting server, the increased chance of slower performance.
The most important website performance metric
Nothing beats an eye ball test. In other words, how does the website perform in real life? What are you and visitors actually seeing? Try viewing the website yourself from both your phone and desktop. Be sure that you have a decent internet connection as your local internet speed will impact how quickly the site loads. While letter grades and scores can vary, the most important metric you’re looking for in both the eyeball test and technical test is “load time.” Having a 3 second load time or less is typically the average bench mark you want to hit. If your site is loading in 3 seconds or under, you’re already doing better than a good chunk of websites out there.
And of course, take some of the suggestions these speed test services offer into account to improve your load time. If you don’t know what the suggestions mean or how to implement the improvements, our webmaster service can help you implement these recommendations. Our webmasters can change the location of scripts, implement caching, help you setup CDNs, or even consult on better hosting server alternatives so that you can increase your load time to get better performance so your visitors have a better experience.
